Diagnosing the Mention-to-Citation Leak: How to Read Your Narrative Summary
Operyn’s Narrative Summary diagnoses mention-to-citation leakage by breaking AI visibility into topic-level mention rates, citation rates, citation sources, competitive positioning, and Sankey-mapped citation flows that reveal where AI systems cite, skip, or replace a brand’s content.

Ly Phan
AI Visibility Researcher and Editor
Update on
Product Mechanics

Welcome to Part 4 of the Operyn Product Guide Series. (If you are just joining us, start with Part 1: Calibrating Your AI Tracking Environment.)
In Part 3, we mapped every section of the Dashboard and established what your top-line Brand Visibility number actually measures. Now that you can read those metrics in context, it's time to open the Narrative Summary and learn what's driving them.
The Narrative Summary page loads four header metrics, a full topic breakdown, a competitive scatter plot called The Arena, and a Sankey diagram mapping how citation sources distribute across your topics. Each section surfaces a different layer of this specific question: where are AI models mentioning you, citing you, and skipping you?
The Four Header Metrics
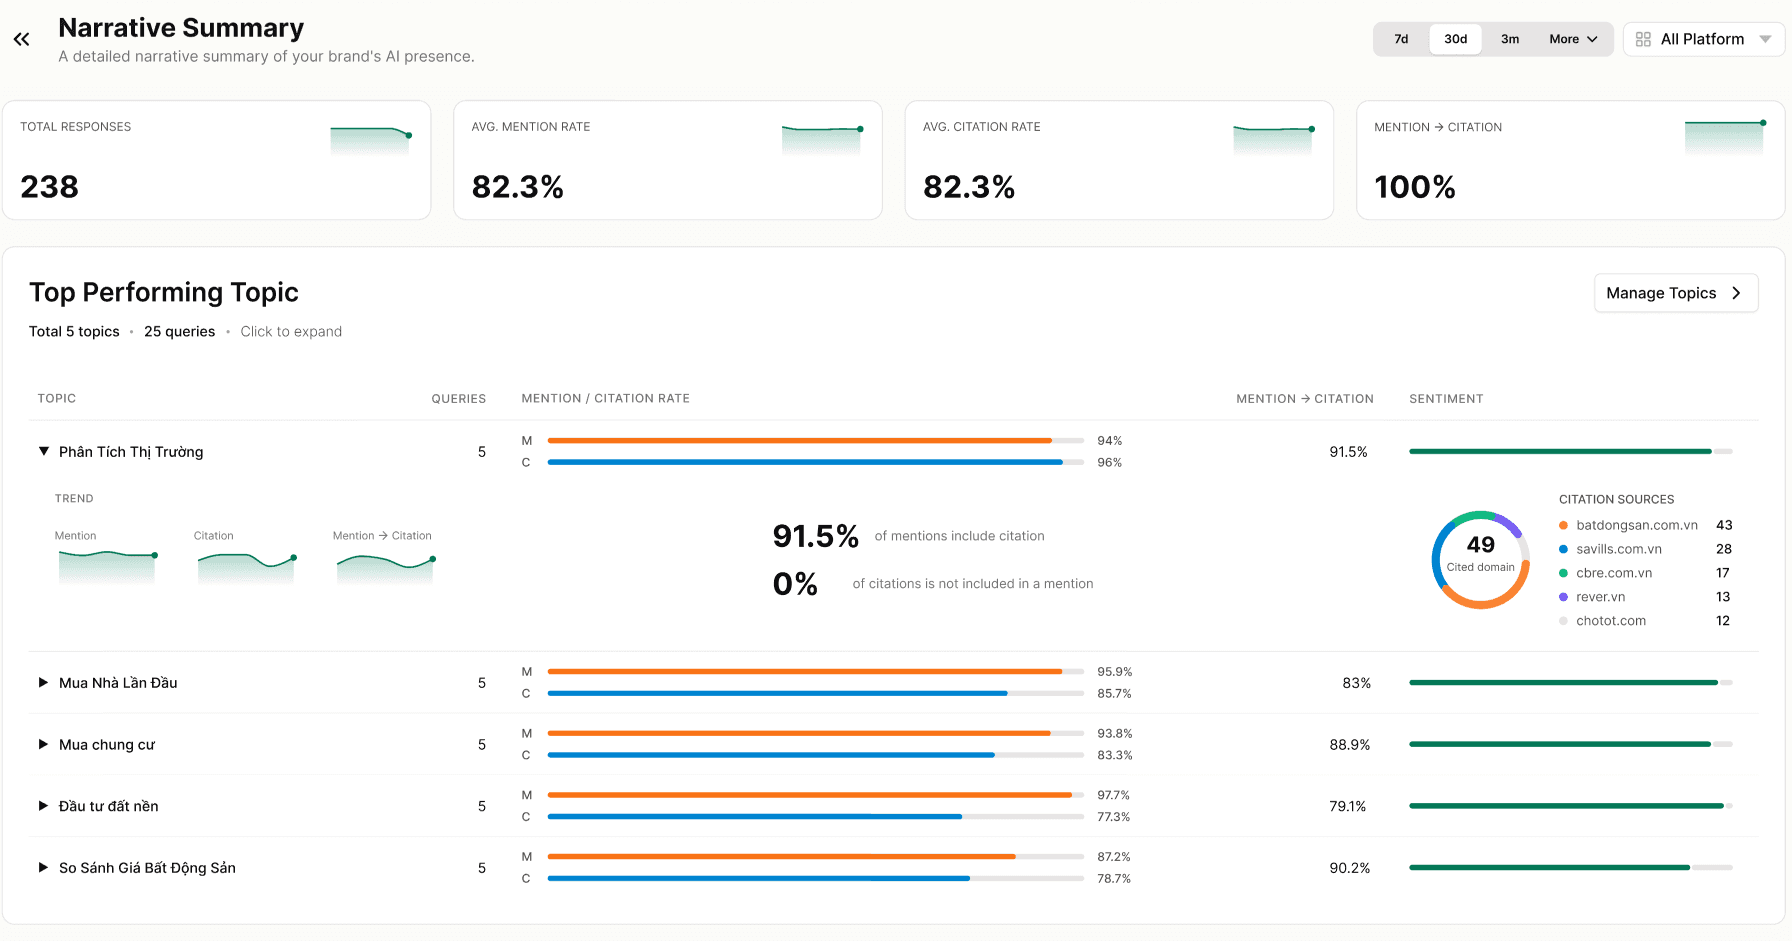
Total Responses counts every AI answer Operyn analyzed across your tracked queries and time window. In the example data here, that figure is 238 responses over a 30-day window. This is the denominator behind every rate on the page. If you expand your query set or extend the time window, this number grows and your rates may shift.
AVG Mention Rate and AVG Citation Rate show your average across all topics. A gap between the two is the first signal to investigate. If your Mention Rate is 82.3% and your Citation Rate is also 82.3% as in this example, your mentions are converting to citations at a high rate. If the Citation Rate were lower by 10 or more points, that gap would tell you AI models recognize your brand but don't reach for a source URL to back it up.
Mention → Citation shows what percentage of your mentions include a citation. In this example, that figure is 100%, which means every mention included a URL. That figure can drop if AI models mention your brand in passing, inside a longer response, without anchoring a specific source. Tracking this metric over time tells you whether your content is earning citation alongside recognition, or just recognition.
Top Performing Topic
Below the header metrics, the Top Performing Topic section lists all your tracked topics in one expandable table. This is the Narrative Summary's primary diagnostic surface.
Each row shows a topic name, query count, Mention Rate bar, Citation Rate bar, Mention → Citation percentage, and Sentiment. Click any row to expand it.
Reading the M/C bars. The orange bar is Mention Rate; the blue bar is Citation Rate. A long orange bar with a shorter blue bar behind it means AI models mention your brand in that topic but pull fewer citations. Topics where the bars are nearly equal length are converting mentions to citations efficiently.
Mention → Citation percentage. This column narrows the bars to a single number. A topic showing 91.5% (as in this example) means 9 out of 10 mentions in that topic include a citation back to your domain. A topic at 79% means 1 in 5 mentions does not. Those uncited mentions may reflect parametric recall (the model answered from training data without triggering a web search) or genuine citation leakage where a competitor's URL filled the slot instead. The Citations tab is where you trace which scenario applies.
Citation Sources donut chart. Expand a topic row and you see a donut chart showing which external domains earned citations within that topic. The number at the center is the total count of cited domains. The listed sources tell you who else is getting cited alongside you, or instead of you, when AI models answer queries in that topic cluster. If a competitor domain appears frequently here but rarely in your competitor tracking, you may have an untracked competitor pulling citations in a topic you thought you owned.
Trend sparklines. The expanded view also shows three sparklines: Mention trend, Citation trend, and Mention → Citation trend. A rising Mention trend with a flat Citation trend means your brand recognition is growing in AI responses but your content isn't earning the citation alongside it. That pattern points toward a URL-level problem, not a brand-recognition problem.
The Arena
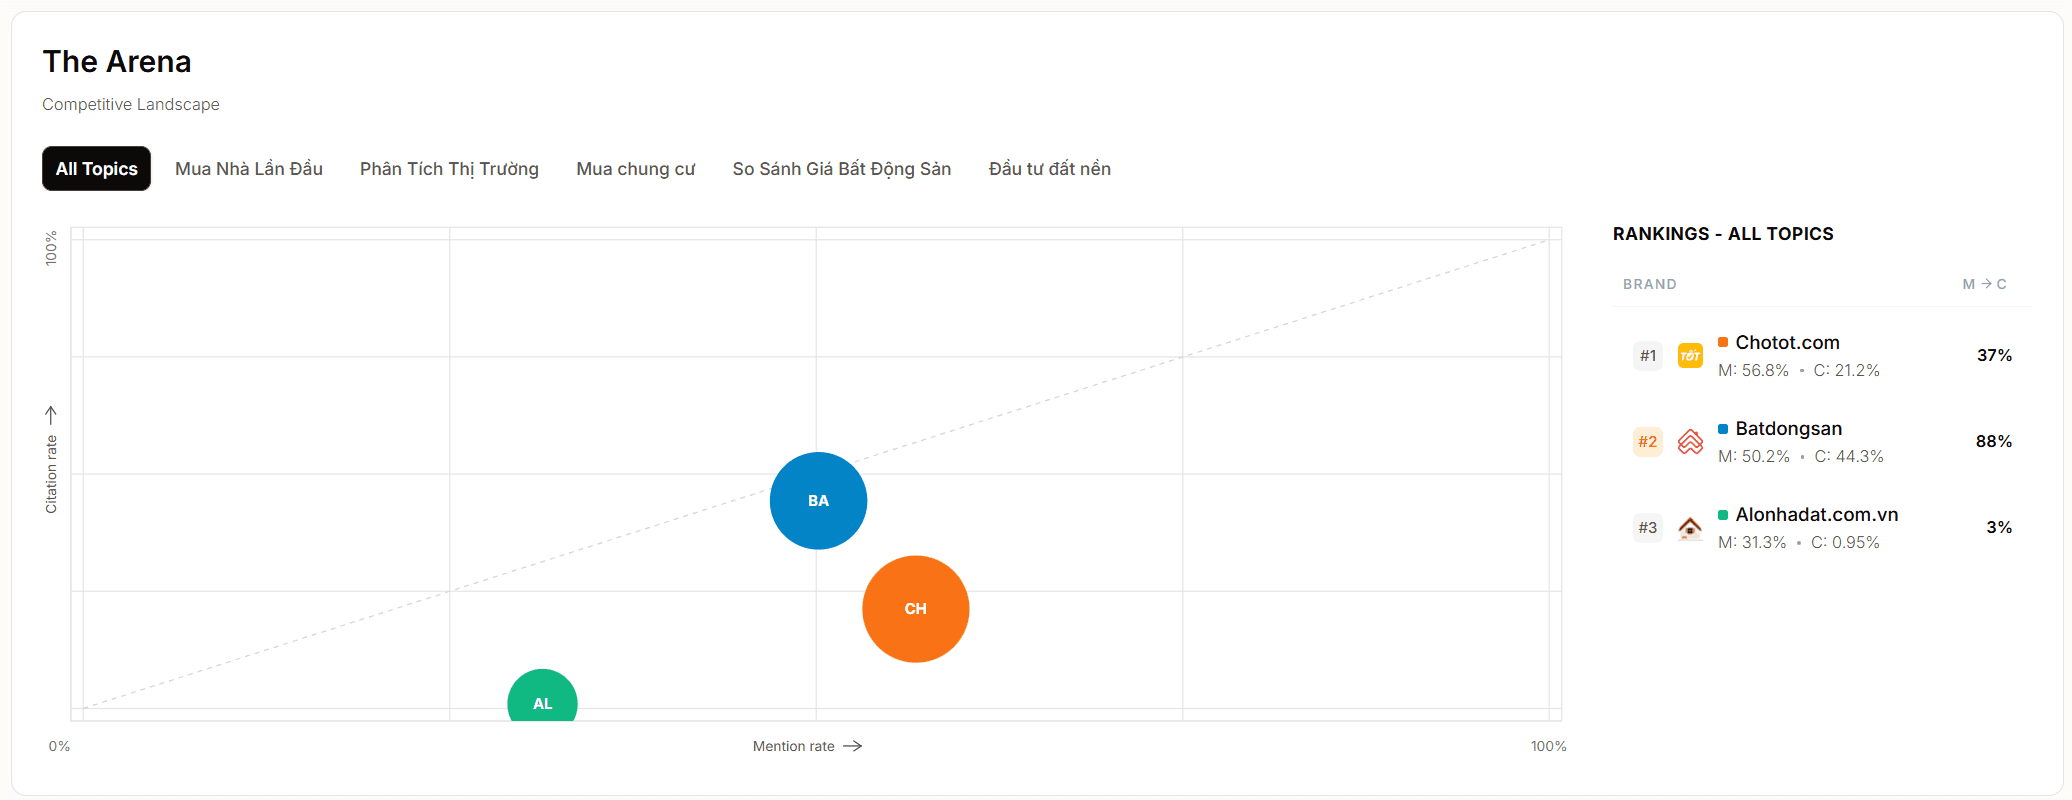
The Arena is a scatter plot directly below the topic table. It plots every brand Operyn tracks against two axes: Mention Rate on the X axis and Citation Rate on the Y axis, both expressed as percentages. Each dot represents one brand. Dot size reflects relative mention volume.
Use the topic filter tabs above the chart to toggle between All Topics and individual topic views. A brand's position can shift between topics, which tells you where competitors are strongest.
Reading the quadrants. A brand in the upper right (high mention rate, high citation rate) has strong AI presence with supporting evidence behind it. A brand in the lower right (high mention rate, low citation rate) is well recognized but losing citation slots. A brand in the upper left (low mentions, high citation rate relative to mentions) has a small footprint but earns citations whenever it does appear. The lower left is the floor: low mentions, low citations, minimal AI presence.
Your brand's position on The Arena gives you a competitive frame for the Mention Rate and Citation Rate numbers in the header.
The Rankings table. To the right of the scatter plot, the Rankings table lists every tracked brand with their Mention Rate and Citation Rate side by side. This is the fastest way to spot which competitors are converting mentions to citations at a rate that threatens your position, and which are visible but not earning the citation.
Citation Source Map
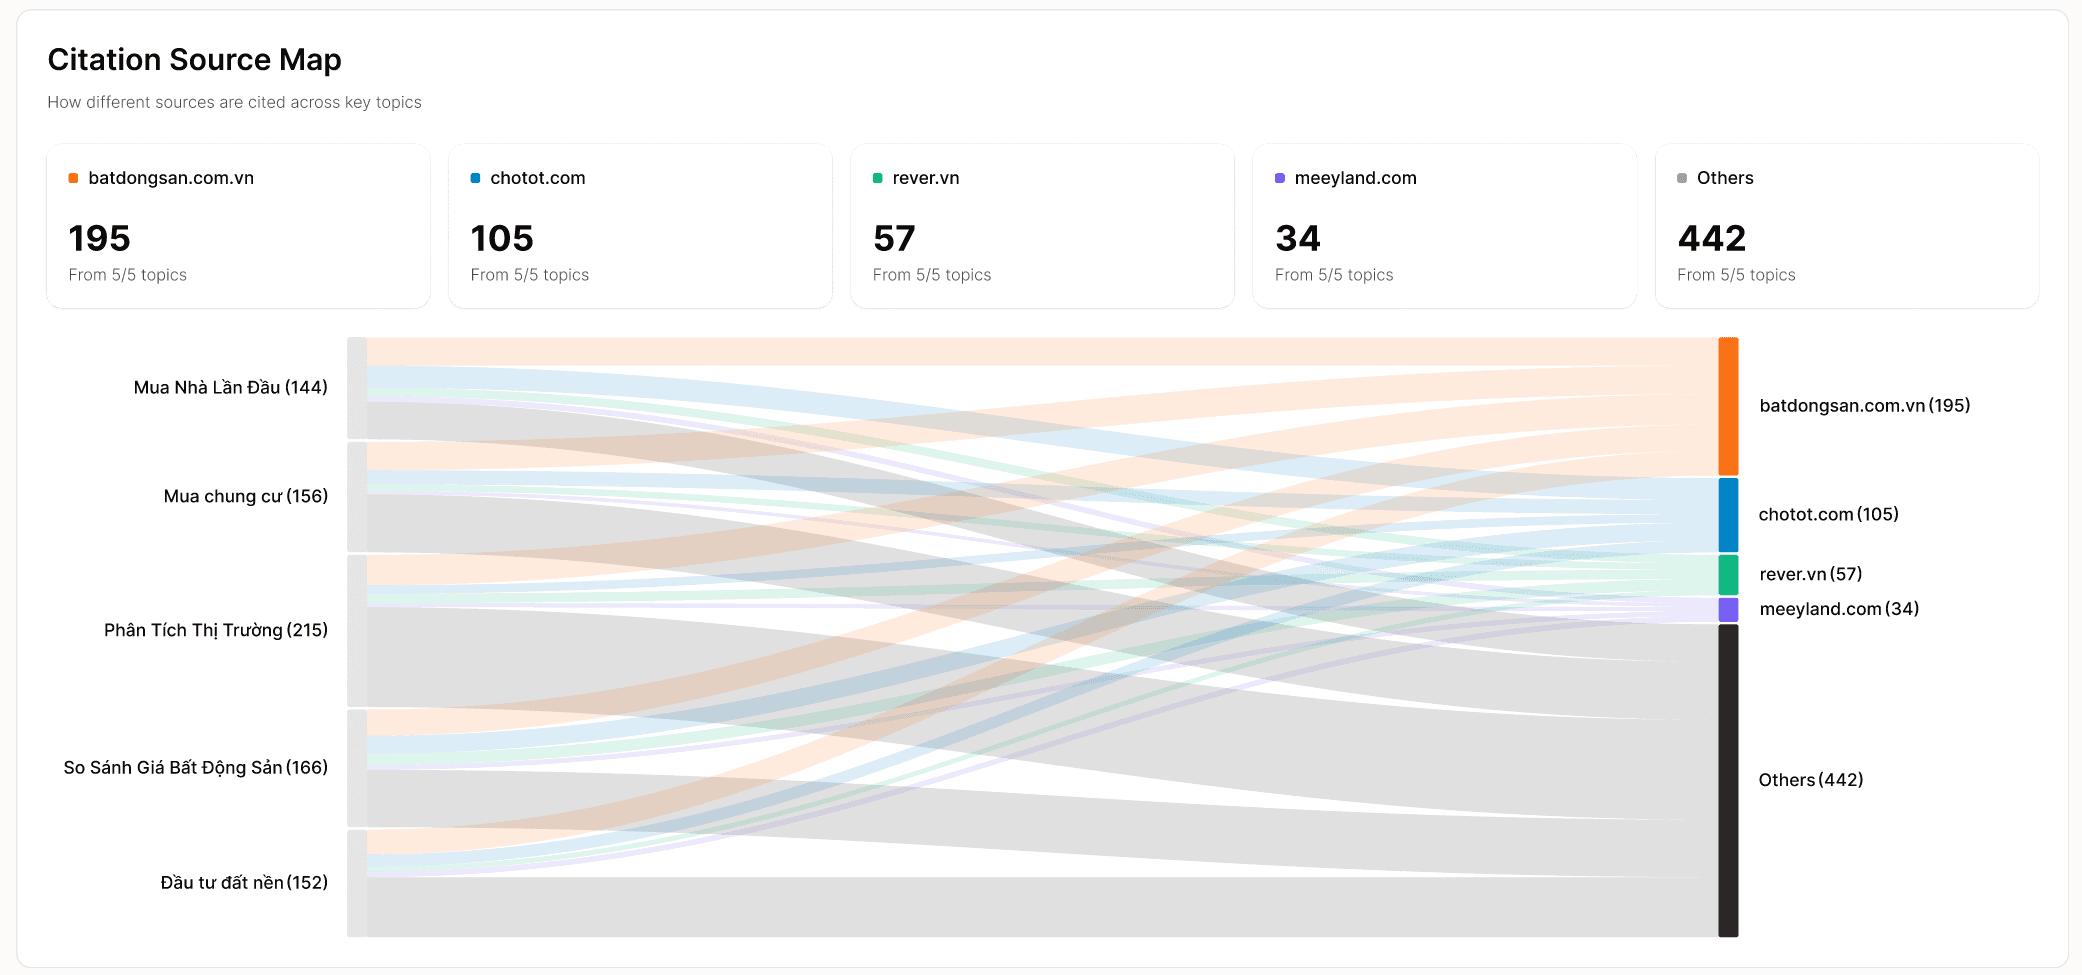
At the bottom of the Narrative Summary, the Citation Source Map is a Sankey diagram. Topics appear on the left; citation domains appear on the right. The flowing bands between them show how citation volume distributes from each topic to each domain.
Above the diagram, summary cards list each domain's total citation count and how many of your tracked topics it appears in. A domain cited across all your topics is embedded broadly in AI responses about your category. A domain that appears in only a subset of topics is a stronger citation source in certain clusters than others, which tells you where that competitor's content authority is concentrated.
A wide band connecting a topic to your domain means AI models cite your content when answering queries in that cluster. A thin band, or no band, means your content is not being surfaced as a citation source for that topic despite whatever mention presence you may have.
The Citation Source Map also tells you how much citation volume flows to sources outside your tracked competitors. In the example here, "Others" accounts for the largest share of citations across all five topics. That is the share of citations going to domains you haven't identified or aren't tracking yet. If that band is large relative to your own, it is worth opening the Citations tab to identify which domains are inside it.
Diagnosing the Mention-to-Citation Leak
Run this sequence when you open the Narrative Summary:
Check the Mention → Citation header figure first. If it is lower than you expect, expand your topic table and find which topic is pulling it down. Look at the Citation Sources donut for that topic to see if a competitor domain is filling the citation slot. Then cross-reference with the Citations tab to identify the specific URLs and queries involved.
Check The Arena for each topic separately. A brand that appears to trail you in the All Topics view may be dominant in a single topic cluster that matters to your pipeline.
Use the Citation Source Map to identify topics where your citation bands are thin relative to your mention presence. Those are your highest-priority content gaps.
Next in this series: Part 5 covers the Competition module: how to read the Brand Performance table, interpret the Topic Battlegrounds heatmap, and use the Most Mentioned Brands treemap to identify threats that aren't visible in your top-line SOV numbers.
Share on social media


