Mapping Threat Vectors: How to Read the Competition Dashboard
Operyn’s Competition module shows which competitors are strongest in AI search by comparing Share of Voice, mentions, citations, topic-level battlegrounds, and proportional mention volume so teams can identify true citation threats and topic-specific competitive gaps.

Ly Phan
AI Visibility Researcher and Editor
Update on
Product Mechanics

Welcome to Part 5 of the Operyn Product Guide Series. (If you are just joining us, start with Part 1: Calibrating Your AI Tracking Environment.)
In Part 4, we used the Narrative Summary to diagnose where your Mention-to-Citation rate drops by topic and citation source. Part 5 shifts the lens from your brand to your competitors. Open the Competition module from the left sidebar.
The Competition module has three sections: Brand Performance, Topic Battlegrounds, and Most Mentioned Brands. Each one answers a different competitive question.
Brand Performance
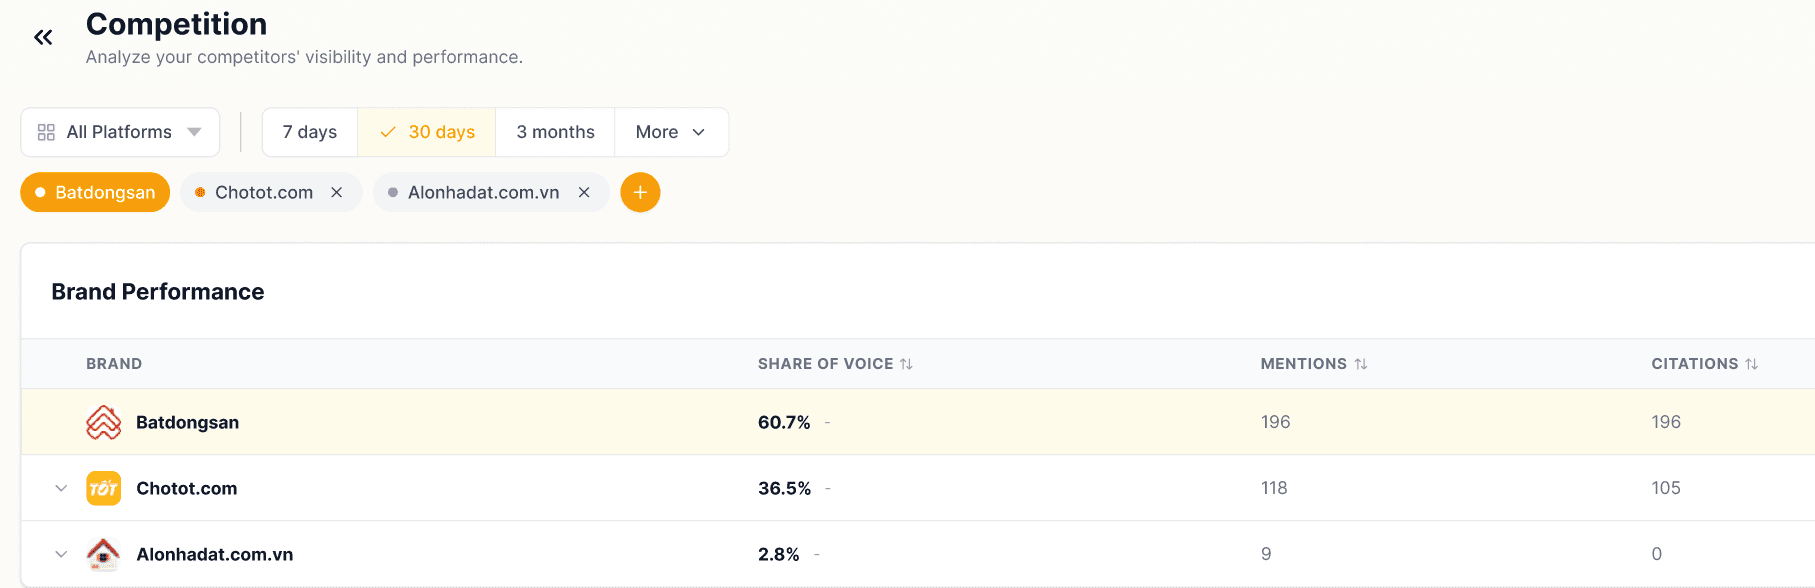
The Brand Performance table is the first thing you see. It lists every tracked competitor with their Share of Voice, Mentions, and Citations side by side.
Share of Voice is calculated across all tracked queries in the selected time window. A competitor at 36.5% SOV is appearing in more than a third of AI responses in your category. That figure alone doesn't tell you whether they're a citation threat or just a mention presence. The Citations column does.
Mentions vs. Citations. A competitor with some mentions but zero or near-zero citations (as in the example here, where one competitor has 9 mentions and 0 citations) is recognized by AI models but not earning source URLs. Their brand awareness in AI responses is not backed by content authority. A competitor with mentions and citations close together is converting recognition into cited sources, which is the more durable position.
Use this table to rank your competitors by citation count, not just SOV. The brand with the second-highest SOV may not be your biggest citation threat.
Topic Battlegrounds
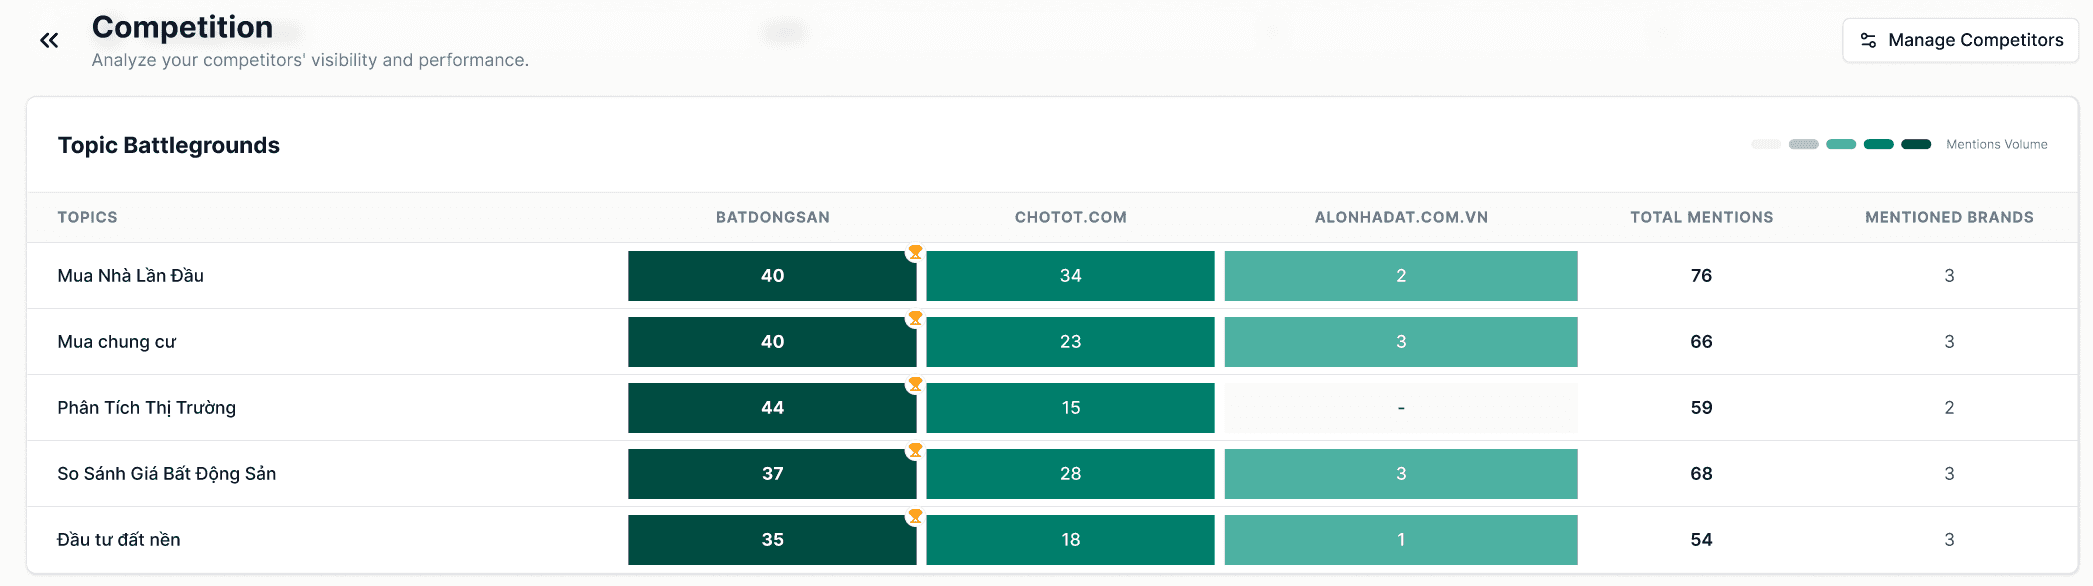
Below the Brand Performance table, the Topic Battlegrounds heatmap shows every tracked topic as a row and every tracked brand as a column. Each cell shows that brand's mention count within that topic.
Read across a row to see how mention volume distributes across competitors within a single topic. A topic where your brand leads by a wide margin is one where you have strong AI presence. A topic where a competitor's cell is close to yours, or larger, is where they are competing for the same AI responses.
Read down a column to see where a specific competitor is most active. A competitor that appears concentrated in two or three topics is a specialist. One that appears across all topics at meaningful volume is a broad presence threat.
The Total Mentions column on the right shows aggregate mention volume per topic across all tracked brands. Higher total mentions means more competitive activity in that topic cluster: more brands getting named, more citation slots being distributed. A topic with high total mentions and a low count in your column is a gap worth investigating.
The Mentioned Brands column shows how many distinct brands appear in AI responses for each topic. A topic with 2 mentioned brands is more concentrated than one with 5. Concentration means fewer competitors to displace; it also means AI models have formed stronger associations in that topic and may be harder to shift.
Most Mentioned Brands
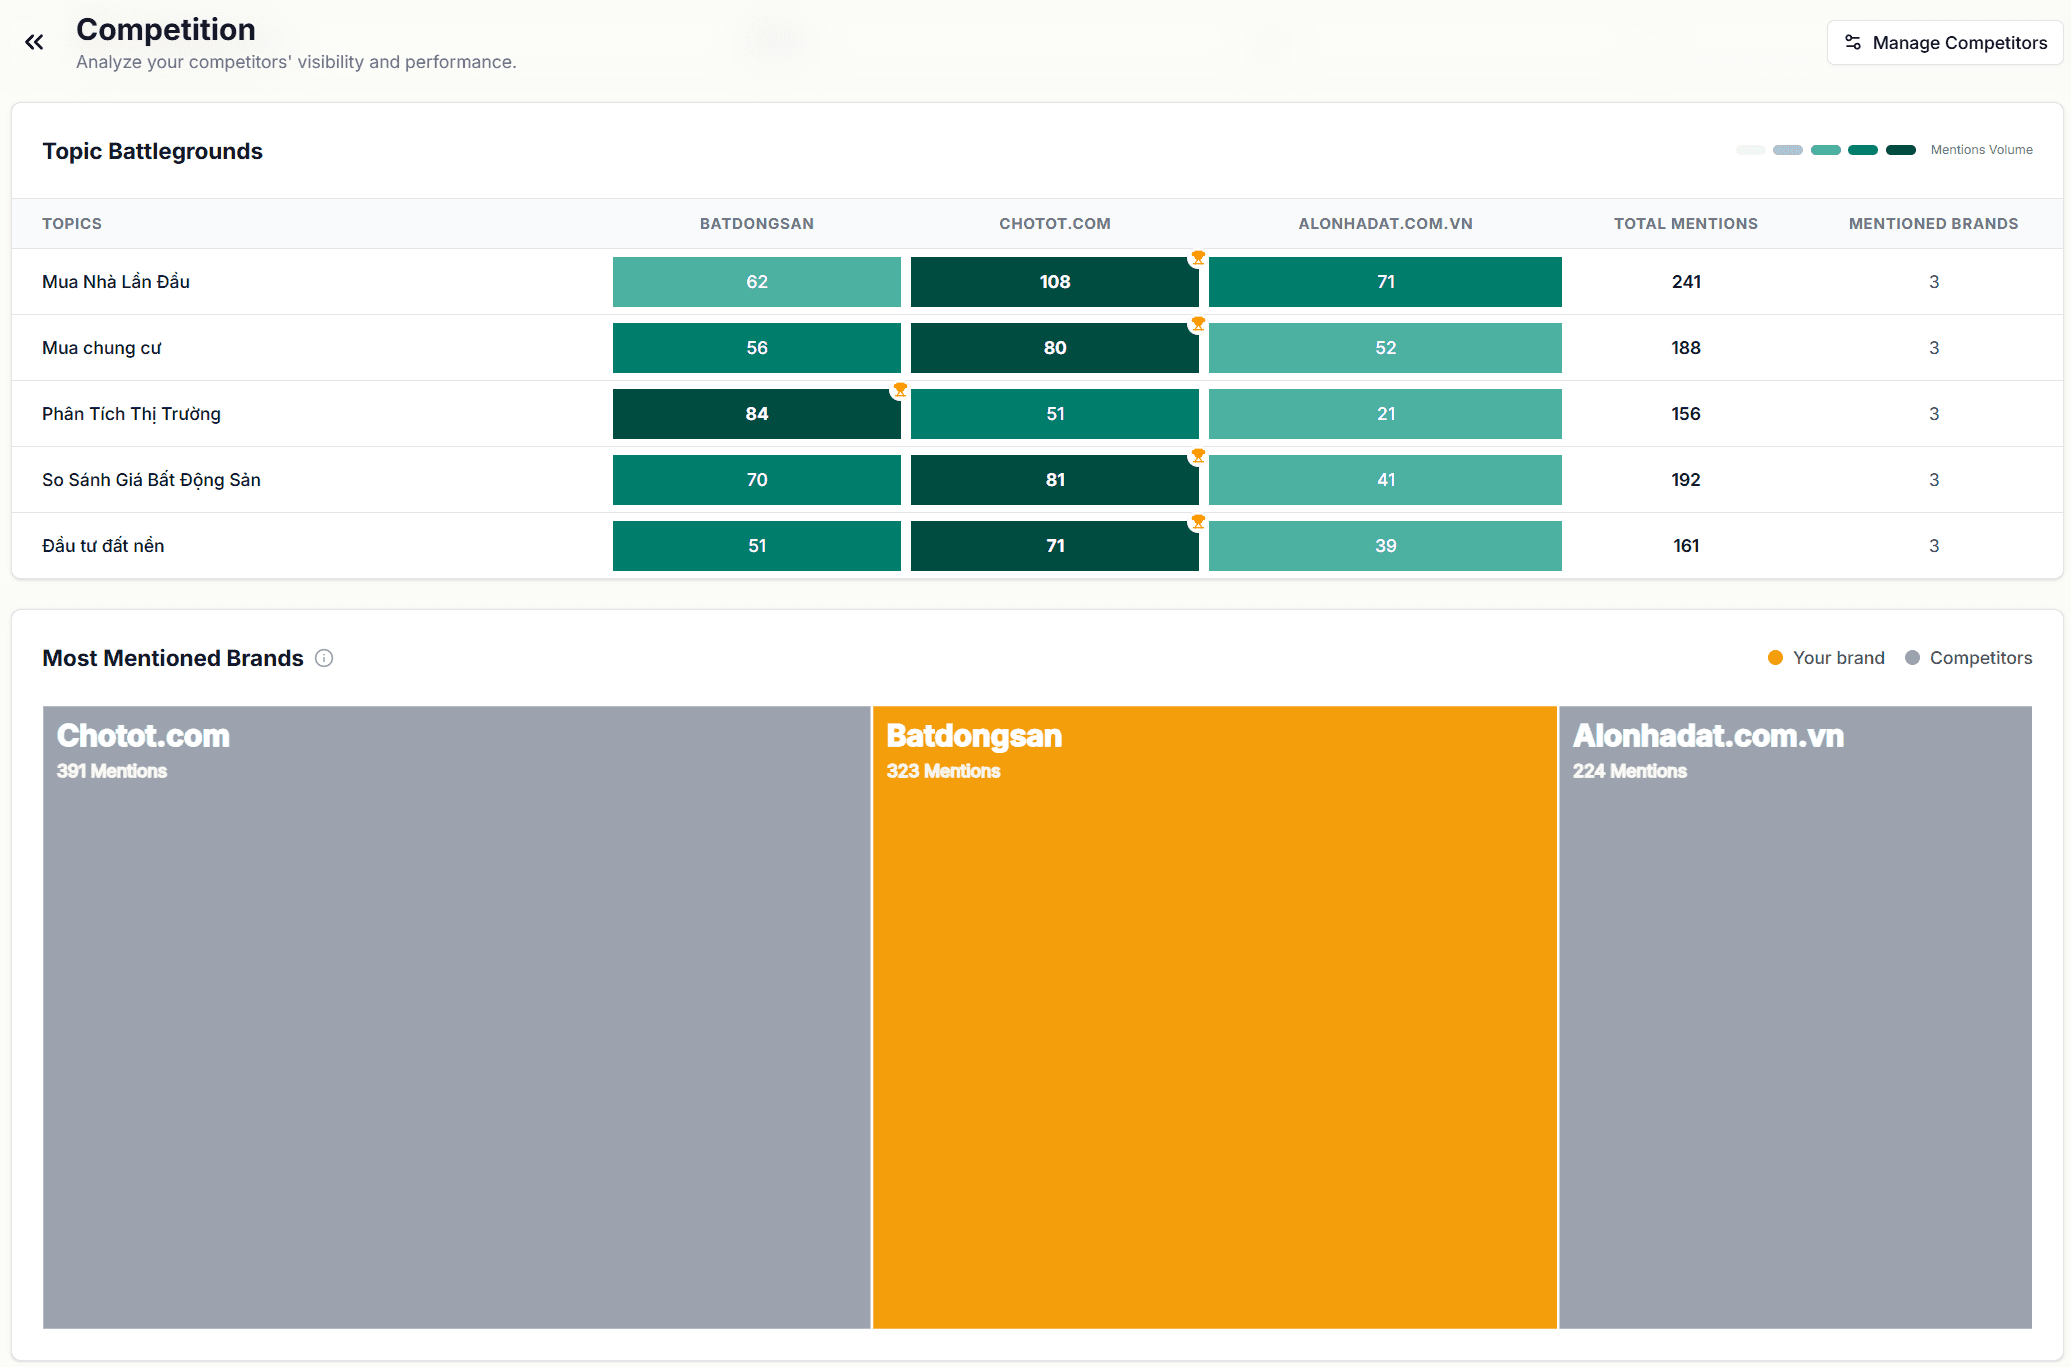
The Most Mentioned Brands treemap at the bottom of the Competition module visualizes mention volume as proportional blocks. Your brand and each tracked competitor gets a block sized to their mention count.
The treemap makes relative scale legible at a glance in a way the table does not. A competitor whose table row looks modest becomes more visible when their block sits directly next to yours. The inverse is also true. A competitor you may have been watching can look less significant once you see their actual proportion of total mentions.
Use the treemap as a sense-check on the Brand Performance table, not a replacement for it. The table gives you the precise figures; the treemap gives you the proportional picture.
Reading the Competition Module Together
Start with Brand Performance to rank competitors by citation count. Identify any brand with a citations-to-mentions ratio that approaches yours. That is your most direct threat in AI search results.
Move to Topic Battlegrounds and filter to the topics that matter most to your pipeline. Find where that competitor's mention count is closest to yours. Those are the specific topic clusters where you are competing for the same citation slots.
Cross-reference with The Arena in the Narrative Summary. A competitor who looks moderate in the Brand Performance table may occupy a strong quadrant position in a specific topic, which the Competition module's heatmap will confirm.
Next in this series, Part 6: Auditing URL Resolution - How to read the Cited Page and Query Tabs, interpret citation rate trends by URL, and use the filter to triage which pages are earning citations and which are losing ground.
Share on social media


